A new global model puts a hard number on a risk long discussed in broad terms: about 9. 3% of the world’s land area is highly vulnerable to disease outbreak threats. The figure is more than a statistical marker. It shows that the danger is not evenly spread, and that some regions are carrying a much heavier burden than others.
Verified fact: The research maps epidemic-prone diseases across nearly every country on Earth using machine learning and satellite data. Informed analysis: The significance of the work is not only where risk exists, but how environmental change and weak detection capacity can combine to make that risk harder to contain.
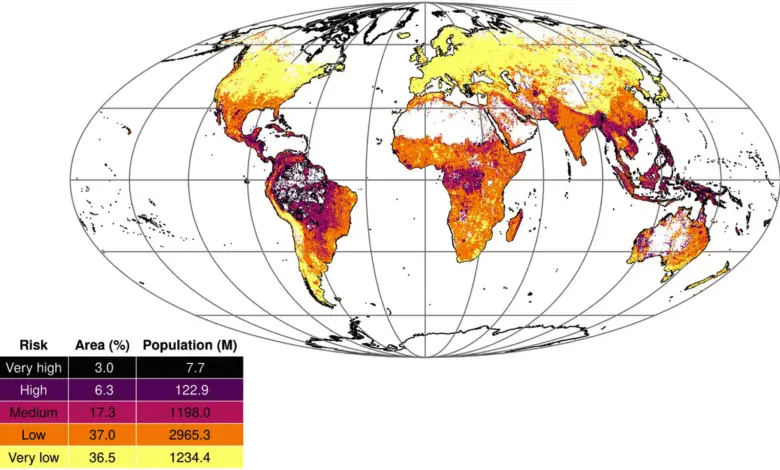
What is the map actually showing?
The model identifies 6. 3% of global land area as high risk and another 3% as very high risk. Roughly 20% of people live in medium-risk areas, while 3% inhabit zones classified as high or very high risk. The hotspots are concentrated in Latin America and Oceania, where communities already face pressure from climate change and land development.
The research was led by Angela Fanelli, a veterinary epidemiologist at the European Commission’s Joint Research Centre. Her work focuses on how human-driven environmental change shapes epidemic risk and strains countries’ abilities to respond effectively to crises. That detail matters because the model is not only measuring exposure; it is pointing to a widening gap between where threats emerge and where response systems may be weakest.
Why do these disease outbreak hotspots cluster in the same places?
Most of the diseases in the map are zoonotic, meaning they move from animals to people through infection and contact. An overview cited in the research estimated that around three quarters of emerging infections in humans worldwide start in other animals. That makes the geography of human settlement central to the risk.
When people expand settlements into forests or wildlife markets, crowding raises spillover, the moment when a virus crosses into humans. Clearing forests for farms, roads, and mines moves people closer to wildlife that can host new viruses and pathogens. Dense settlements and industrial farms increase the chances that viruses can jump and spread quickly.
The model also shows that climate is not a background factor. Warming air and water change where animals, insects, and viruses can thrive, reshaping the basic geography of infectious disease. Higher temperatures, heavier rainfall, and deeper droughts all push outbreak risk upward. Longer warm seasons let disease-carrying mosquitoes and ticks survive in new places, pushing previously tropical infections into higher latitudes.
Who is most exposed, and what does the study leave unanswered?
Verified fact: The map places all of the WHO priority diseases included in the analysis on a short list of carefully monitored dangerous zoonotic threats. It also identifies countries that are most vulnerable to outbreaks and least equipped to detect and contain them. Informed analysis: That combination suggests the central problem is not just environmental exposure, but preparedness inequality.
The study does not name every country in the summary provided here, so the narrowest defensible reading is regional rather than country-specific. What is clear is that vulnerability is concentrated in places already under strain from land development and climate pressure. In that setting, the ability to detect and contain a disease outbreak becomes as important as the exposure itself.
That is why the distinction between high risk and very high risk matters. The map is not simply warning of future disease spread; it is identifying where the conditions for a disease outbreak are already assembling. The implication is that surveillance, land-use decisions, and climate stress cannot be treated as separate policy files.
Who benefits from the new modeling — and who is left exposed?
The immediate benefit is for public health planners, wildlife risk specialists, and governments that need a clearer sense of where resources should go first. The model also gives researchers a way to compare hazard across countries and regions rather than relying on isolated case counts.
For communities in high-risk zones, the picture is more troubling. If warming, land conversion, dense farming, and expanding settlement continue to push people, animals, and vectors into closer contact, then the conditions behind a disease outbreak may intensify faster than local systems can respond.
The study’s value is that it links environmental pressure to response capacity in one frame. That makes the policy question harder to avoid: if risk is concentrated and known, then the remaining uncertainty is not whether exposure exists, but whether authorities are acting early enough to reduce it.
The evidence points in one direction. The world is not facing a random spread of danger, but a patterned disease outbreak geography shaped by land use, climate stress, and uneven readiness. If that pattern is accurate, then transparency on vulnerable regions, stronger surveillance, and faster containment planning are no longer optional; they are the minimum response to a disease outbreak landscape that is already taking shape.