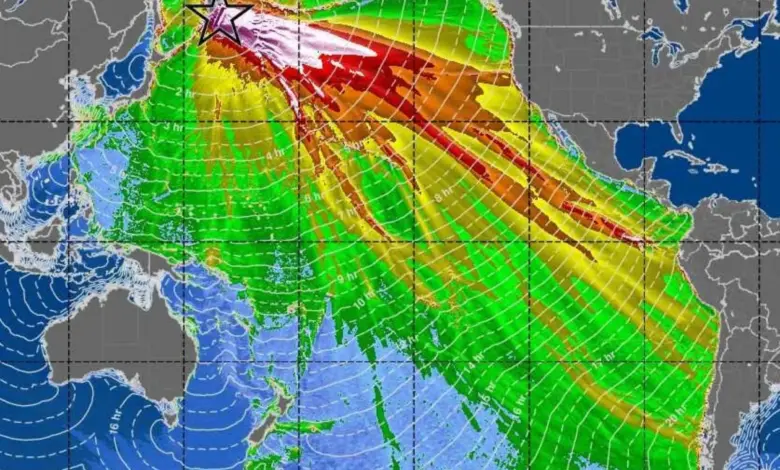
The word tsunami usually suggests a single roaring wall of water, but a July 29, 2025 event in the Pacific exposed something more complicated. A magnitude 8. 8 earthquake off Russia’s Kamchatka Peninsula produced a Pacific-wide tsunami, and a satellite pass over the region captured a rare high-resolution view of the wave field as it formed. The images, taken roughly 70 minutes after the quake, showed not just a leading wave but a braided train of trailing energy that may force researchers to rethink how some ocean-crossing waves are modeled.
A rare window into tsunami formation
The event mattered because it offered a look at a subduction-zone tsunami at the source, a setting that is usually difficult to observe in detail. Scientists have long understood the chain reaction: a major rupture shifts the seafloor, which in turn displaces the water above it. What has been missing is a clear view of how that disturbance organizes itself in the open ocean before it reaches land.
NASA and the French space agency’s SWOT satellite provided that window. Designed to map surface water and ocean circulation, the satellite happened to pass over the Pacific after the quake and captured a wide swath of sea surface height. The view revealed a complicated pattern of energy dispersing and scattering over hundreds of miles, rather than a single clean crest moving outward. That distinction is central to why this tsunami has drawn so much attention.
What the satellite saw that older tools often miss
Until now, deep-ocean DART buoys have been the best open-ocean sentinels for tsunami tracking. They are highly sensitive, but each one measures conditions at a single point. SWOT changes that by mapping a swath about 75 miles wide in one pass, allowing scientists to see both geometry and evolution across space and time.
Angel Ruiz-Angulo of the University of Iceland, the study’s lead author, described SWOT data as “a new pair of glasses, ” contrasting it with the older point-by-point view provided by DART buoys. He also noted that earlier satellites could only see a thin line across a tsunami in the best case, while SWOT can capture a much wider section with unprecedented resolution. In practical terms, that means researchers can now compare the shape of the wave field with model predictions instead of relying only on isolated time series.
The Kamchatka event showed why that matters. When the team ran numerical models that included dispersive effects, the simulated wave field matched the satellite pattern far better than non-dispersive runs. Ruiz-Angulo said the SWOT data challenged the idea that big tsunamis are always non-dispersive. For tsunami forecasting, that is not a small adjustment; it suggests some models may be missing wave behavior that becomes important as the system moves toward shore.
Why tsunami models may need revision
The key issue is that dispersion can reorganize the wave train’s energy. Ruiz-Angulo said this extra variability could mean the main wave is modulated by trailing waves as it approaches coastlines, and that researchers need to quantify whether this excess dispersive energy has impacts that were not previously considered. The study does not claim every large tsunami behaves this way, but it does show that at least in this case, the simplest assumptions did not fully match what the satellite observed.
That mismatch is reinforced by the measurements from DART buoys. Two gauges did not line up with tsunami predictions from earlier seismic and geodetic source models: one recorded the waves earlier than expected, and the other later than expected. Together with the satellite image, that timing difference suggests the source-to-ocean pathway may be more complex than the standard long-wave picture captures.
Expert view and broader Pacific implications
Ignacio Sepúlveda of San Diego State University, who led the Coastal Engineering Lab team using SWOT to observe the event, said the simplest long-wave model did not reproduce all the properties seen by the satellite. That matters because the quality of a forecast depends on how well the model reflects reality at the source. Sepúlveda’s team found that SWOT revealed both the leading wave and a train of smaller waves behind it, a structure that existing tsunami-monitoring systems are not designed to map in full.
For the Pacific region, the implications are broader than a single earthquake. The basin is large, and tsunami waves can travel far before reaching shore. A satellite capable of seeing the wave field in mid-ocean gives researchers a new way to test whether the physics in their models matches the actual behavior of a tsunami. If the models can be improved, future forecasts may better capture how energy evolves across the ocean rather than only how it behaves at isolated points.
For now, the message is less about certainty than about precision. This tsunami did not just move across the Pacific; it exposed the limits of some of the tools used to understand it. The next question is whether future satellite passes will show the same pattern, or whether this was a rare event that still leaves open how often such dispersive behavior should change the forecast.