A magnitude 8. 8 earthquake, a Pacific-wide tsunami, and a satellite pass that happened at exactly the right moment turned a deep-ocean event into a rare test of what scientists thought they knew about wave behavior. The key word is tsunami, but the more important story is what the new image shows beneath the surface: a braided, scattered energy field rather than a single clean wavefront.
What did the satellite actually see?
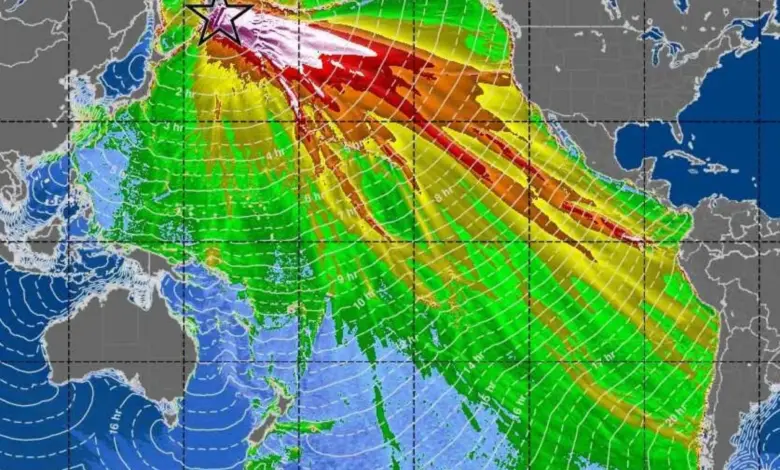
On July 29, 2025, an earthquake in the Kuril-Kamchatka subduction zone triggered a tsunami across the Pacific. NASA and the French space agency’s SWOT satellite happened to pass overhead and captured the first high-resolution, spaceborne swath of a great subduction-zone tsunami. The image did not show a neat crest racing across the ocean. It showed complicated energy spreading and scattering over hundreds of miles.
That detail matters because traditional instruments rarely resolve a tsunami in this way. Deep-ocean DART buoys remain the best open-ocean sentinels, but each one records only a time series at a single point. SWOT, by contrast, maps a 75-mile-wide swath of sea surface height in one pass, letting scientists see geometry evolve in both space and time. In this case, the satellite provided a mid-ocean view that earlier tools could not.
Why does this matter for tsunami forecasting?
The central question is not whether a tsunami occurred. It is whether the physics used to forecast tsunami hazards is missing something important. The observation challenged the idea that the largest ocean-crossing waves travel mainly as non-dispersive packets. In simple terms, the satellite image suggested that the wave field was more complicated than the standard picture.
Study lead author Angel Ruiz-Angulo of the University of Iceland described SWOT data as a new pair of glasses, saying that DARTs could only show the tsunami at specific points in the vastness of the ocean. He added that other satellites had previously seen only a thin line across a tsunami, while SWOT captured a swath up to about 120 kilometers, or 75 miles, wide with unprecedented high-resolution data. That broader view gave researchers a direct look at how the wave train behaved while still far from shore.
What did the models get wrong?
When the team ran numerical models that included dispersive effects, the simulated wave field matched the satellite pattern far better than non-dispersive runs. Ruiz-Angulo said the main impact for tsunami modelers is that something is missing in the models that are used now. He added that the extra variability could mean the main wave is modulated by trailing waves as it approaches some coast, and that the dispersive energy needs to be quantified to determine whether it has an impact that was not considered before.
This is where the satellite observation becomes more than a striking image. It becomes evidence that the long-standing simplifying assumptions may not fully capture the behavior of this tsunami. The event was not just a pass-fail test of one model. It was a reminder that a Pacific-scale wave can carry structure that standard formulations may smooth out.
Who is positioned to benefit from the new view?
Scientists working on tsunami science stand to gain the most immediately. Ignacio Sepúlveda of San Diego State University led a team that used SWOT to observe the Kamchatka tsunami and said the result gives an unusually clear view into tsunamigenesis, or the birth of a tsunami. Sepúlveda’s team found that when they simulated the event with the simplest long-wave model, the model did not reproduce all the properties seen by SWOT. The issue was the trailing dispersive waves that long-wave models do not account for well.
SWOT was launched in December 2022 by NASA and the French space agency CNES to survey surface water around the world. It was not built specifically for tsunami detection, yet it happened to capture a crucial event 70 minutes after the earthquake and roughly 375 miles from the epicenter. Two DART gauges also did not line up neatly with earlier tsunami predictions from seismic and geodetic source models: one recorded the waves earlier than expected, and the other later.
That mismatch does not settle the case alone, but it strengthens the argument that tsunami forecasting may need a broader evidentiary base. The most important fact is now clear: the tsunami was not only large, but complex in ways the satellite could finally see.
The accountability question is straightforward. If a single pass from SWOT can reveal structure that earlier methods missed, then tsunami models, warning practices, and future hazard assessments should be examined with that evidence in mind. The Pacific event showed that a tsunami can carry more variability than the simplest calculations assume, and the keyword is tsunami because this is exactly the kind of moment when definitions, models, and public expectations must be checked against the data.